
New sales figures from the BCLDB show that wholesale grams sold and wholesale cannabis sales in the province have increased significantly in Q1 2022 compared to the same quarter in 2021.
The new figures, the first ever offered from BC, give a look at wholesale sales in different product categories, as well as both volume and dollar amounts.
Wholesale sales represent the cost value (wholesale price) of cannabis products shipped to all wholesale customers in the province. This includes private stores, BC Cannabis Stores (BCCS), the BCCS online sales platform, and the LDB’s distribution centre.
There was a nearly 30% increase in the total grams sold in the province in April, May, and June 2022 compared to the same period in 2021, along with a more than 17% increase in wholesale sales. Price compression has led to sales figures being lower than total volume, with the average price per gram on all cannabis products dipping by nearly 10%, from $4.86 per gram in Q1 2021 to $4.40 in Q1 2022.
The average price for a gram of dried cannabis dropped from $4.19 a gram to $3.86, while the number of retail stores—public and private—increased from 363 to 442.
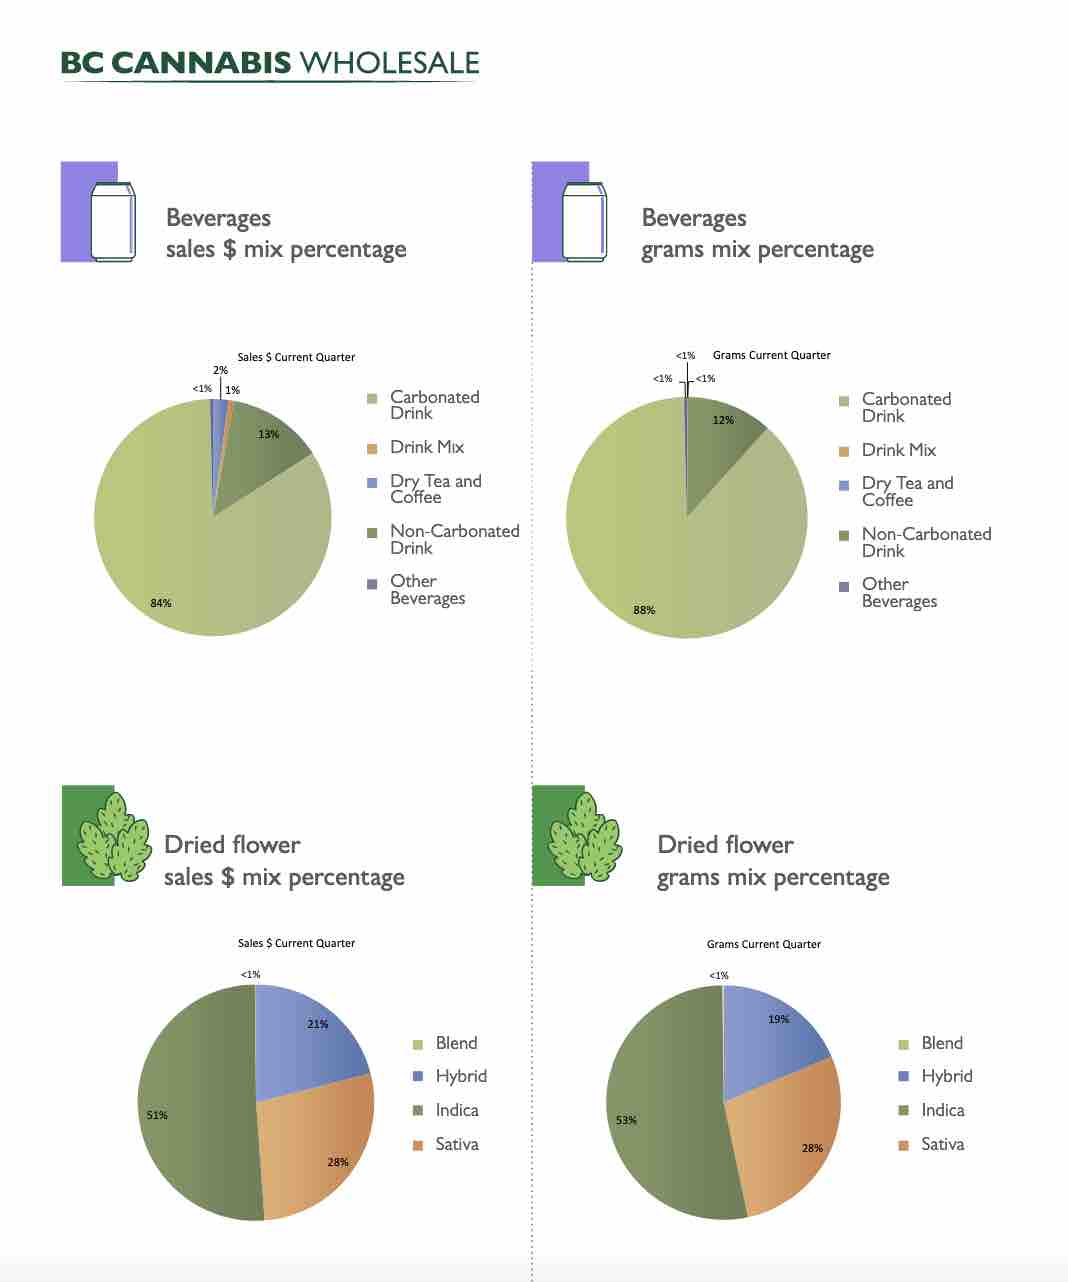
Mirroring similar figures from other provinces, sales for dried flower continue to dominate in BC, but have declined modestly from the previous quarter (Q4 2021), while pre-rolls and inhalable extracts, especially infused pre-rolls, continue to gain momentum.
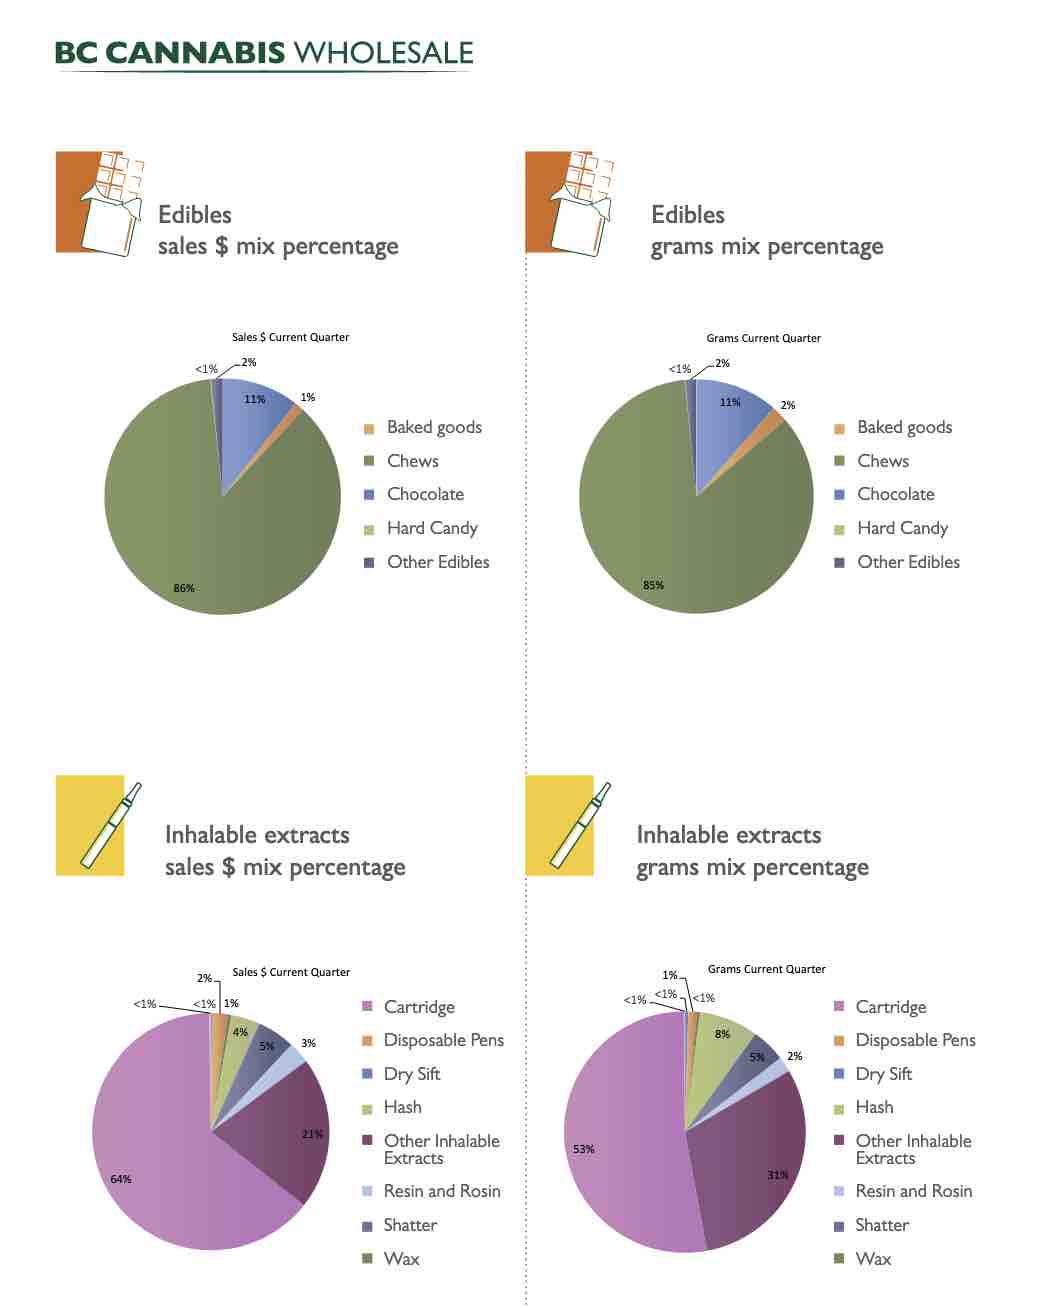
With inhalable extracts, vape cartridges continue to dominate sales, accounting for around 64% of all sales in the category. This is followed closely by infused pre-rolls, a quickly-growing product category, at about 21% of total sales. Shatter, resin, rosin, dry-sift, hash, and disposable vape pens make up around 15% of sales combined.
For edibles, gummies (“chews”) continue to dominate with about 86% of all edibles sales, followed in a distant second by chocolates at around 11%. Baked goods account for about 3% of sales.
In cannabis beverages, carbonated drinks continue to dominate with 84% of total sales and around 13% in the non-carbonated category. Drink mixes, teas, and coffees account for less than about 3% of total cannabis beverage sales in the province.
The report also provides insight into sales figures in the four different delivery zones the LDB serves in BC. Zone 1, which includes BC’s Lower Mainland/Metro Vancouver regions, saw a nearly 32% increase in sales compared to the same period last year, from just over $33 million to nearly $44 million.
Zone 2, or Vancouver Island, saw a 12% increase in sales, from nearly $23 million in Q1 2021 to almost $26 million in the most recent quarter. Zone 3, BC’s broader Interior region, saw an increase in sales of around 10%, from $22.6 million to $25 million. Zone 4, representing BC’s northern regions, saw an increase in sales of about 3%, from $14.2 to $14.7 million.